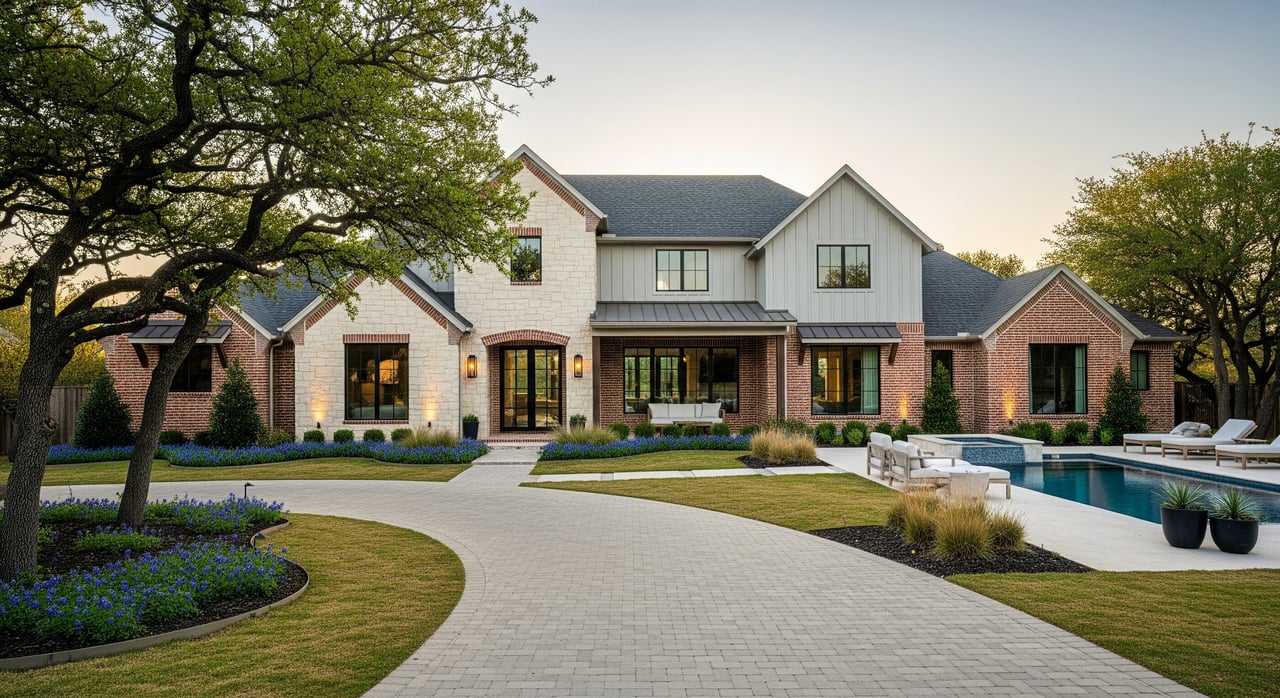
Burleson Rental Property Guide for SFR Investors
January 8, 2026
January 8, 2026
Thinking about buying a rental in Burleson but not sure where to start? You want clear numbers, realistic rent targets, and a simple way to underwrite returns without guesswork. In this guide, you’ll learn how the local market works, how to set price and rent bands, what vacancy to expect, and how to plug your own numbers into conservative return formulas. You’ll also get a step-by-step checklist to vet a single-family home. Let’s dive in.
Burleson sits in the southern part of the Fort Worth–Arlington metro, so its rental demand rides on the broader Dallas–Fort Worth economy. Many residents commute to Fort Worth and parts of Dallas, which keeps single-family homes attractive to renters who want space and suburban amenities.
You can reach major employment hubs in Fort Worth within typical suburban commute times. Access to highways and retail corridors helps, and that convenience tends to support steady interest in single-family rentals.
Suburban growth across DFW, relative affordability compared to core urban neighborhoods, and the region’s employment base all matter. If you plan to invest soon, verify recent population and household growth for Burleson and Johnson County using Census data or city planning reports. Employment trends from the Bureau of Labor Statistics and regional economic groups can help you confirm job growth and wage momentum.
New subdivisions and single-family building activity can increase supply. If new inventory outpaces demand, it can soften rents. Check City of Burleson planning or Johnson County building-permit data to understand what is coming. Amenities like schools, parks, retail, and roadway access can influence desirability. Use neutral, public school data sources when comparing zones and be mindful of seasonal leasing patterns for family renters.
You can estimate price and rent bands in a few hours if you pull the right comps. The goal is to establish a realistic 25th to 75th percentile range for both purchase prices and rents for comparable homes.
Use your MLS or trusted aggregator data to segment recent sales and active listings:
A practical approach is to find Burleson’s current median single-family sale price, then set approximate bands around it. Many investors start with about 75 percent of the median for the lower band, the median for the middle, and about 125 percent of the median for the upper. Always confirm with 6 to 12 recent sold comps that match size, age, and location.
For rent bands, pull 30 to 90 recent single-family rental listings and sort by bedrooms, neighborhood, lot features, and condition. Segment your results by bedroom count and capture a 25th to 75th percentile range. For SFRs, focus on comps within a 2 to 3 mile radius and adjust for amenities like a garage, fenced yard, or recent renovations.
Vacancy and credit loss assumptions of 5 to 10 percent are a conservative starting point for suburban SFRs. Expect some seasonality, especially with family moves in summer. For hyper-local accuracy, ask two or three local property managers about average time to lease, renewal rates, and typical turnover timelines.
Good underwriting starts with disciplined inputs. These ranges help you underwrite without overpromising.
Use this conservative template to test a deal. Replace the variables with actual Burleson comps and quotes.
Small investors often target 6 to 12 percent cash-on-cash returns, depending on leverage and risk tolerance. Cap rates for suburban single-family homes are commonly in the low to mid single digits in competitive metros, but the exact figures depend on current Burleson pricing and rent levels.
Run at least two downside cases so you know your break points:
Confirm you can cover the mortgage and maintain reserves in both cases.
Your property choice drives most of your return. Use this checklist to filter candidates.
Texas-specific costs can materially shift your cash flow. Build these into your base case with quotes, not guesses.
Texas is generally considered landlord-friendly, but you must follow state rules. Evictions, notices, and security deposit accounting are governed by Texas law. Texas does not have statewide rent control. Verify whether Burleson requires rental registration, minimum housing standards, or business licensing for landlords before you list a unit.
Follow this sequence to build a defendable buy box and offer.
A strong SFR in Burleson often pairs a family-friendly layout with reasonable commute access and predictable operating costs. When you underwrite with 5 to 10 percent vacancy and a 35 to 50 percent operating expense ratio, you can set clear return targets and avoid overpaying. You will likely see cap rates in the low to mid single digits for stabilized homes in competitive parts of the DFW metro, and cash-on-cash returns in the mid single to low double digits if you buy at the right basis and manage costs.
If you want help pulling Burleson comps, reality-checking rent bands, or pressure-testing your model, you do not have to do it alone. Our boutique, two-agent team will help you find and evaluate single-family rentals with clear numbers, local insight, and a smooth process from offer to close. Schedule a Free Consultation with Pamela Carter to start building your Burleson investment plan.
Stay up to date on the latest real estate trends.


Pamela and Brooklyn have two different styles when it comes to realestate, which is what makes them a powerful team. They look forward to helping as many people as they can navigate the process of buying, selling or investing in realestate.